Requirements
1. Enable two captures on FTD using these filters:
| Source IP | 192.168.103.1 |
| Destination IP | 192.168.101.1 |
| Protocol | ICMP |
| Interface | INSIDE |
| Source IP | 192.168.103.1 |
| Destination IP | 192.168.101.1 |
| Protocol | ICMP |
| Interface | OUTSIDE |
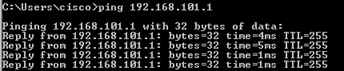
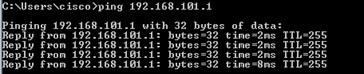
2. Ping from Host-A (192.168.103.1) to Host-B (192.168.101.1) and check the captures.
Solution
Step 1. Enable the captures:
> capture CAPI interface INSIDE match icmp host 192.168.103.1 host 192.168.101.1
> capture CAPO interface OUTSIDE match icmp host 192.168.101.1 host 192.168.103.1
Step 2. Check the captures in the CLI.
Ping from Host-A to Host-B:
> show capture
capture CAPI type raw-data interface INSIDE [Capturing - 752 bytes]
  match icmp host 192.168.103.1 host 192.168.101.1
capture CAPO type raw-data interface OUTSIDE [Capturing - 720 bytes]
  match icmp host 192.168.101.1 host 192.168.103.1
The two captures have different sizes due to the Dot1Q header on the INSIDE interface. This is shown in this output example:
> show capture CAPI
8 packets captured
   1: 17:24:09.122338 802.1Q vlan#1577 P0 192.168.103.1 > 192.168.101.1: icmp: echo request
   2: 17:24:09.123071 802.1Q vlan#1577 P0 192.168.101.1 > 192.168.103.1: icmp: echo reply
   3: 17:24:10.121392 802.1Q vlan#1577 P0 192.168.103.1 > 192.168.101.1: icmp: echo request
   4: 17:24:10.122018 802.1Q vlan#1577 P0 192.168.101.1 > 192.168.103.1: icmp: echo reply
   5: 17:24:11.119714 802.1Q vlan#1577 P0 192.168.103.1 > 192.168.101.1: icmp: echo request
   6: 17:24:11.120324 802.1Q vlan#1577 P0 192.168.101.1 > 192.168.103.1: icmp: echo reply
   7: 17:24:12.133660 802.1Q vlan#1577 P0 192.168.103.1 > 192.168.101.1: icmp: echo request
   8: 17:24:12.134239 802.1Q vlan#1577 P0 192.168.101.1 > 192.168.103.1: icmp: echo reply
8 packets shown
> show capture CAPO
8 packets captured
   1: 17:24:09.122765  192.168.103.1 > 192.168.101.1: icmp: echo request
   2: 17:24:09.122994  192.168.101.1 > 192.168.103.1: icmp: echo reply
   3: 17:24:10.121728  192.168.103.1 > 192.168.101.1: icmp: echo request
   4: 17:24:10.121957  192.168.101.1 > 192.168.103.1: icmp: echo reply
   5: 17:24:11.120034  192.168.103.1 > 192.168.101.1: icmp: echo request
   6: 17:24:11.120263  192.168.101.1 > 192.168.103.1: icmp: echo reply
   7: 17:24:12.133980  192.168.103.1 > 192.168.101.1: icmp: echo request
   8: 17:24:12.134194  192.168.101.1 > 192.168.103.1: icmp: echo reply
8 packets shown
Work with FTD LINA Engine Captures – Export a Capture via HTTP
Requirements
Export the captures taken in the previous scenario with a browser.
Solution
In order to export the captures with a browser, you need to:
- Enable the HTTPS server.
- Allow HTTPS access.
By default, the HTTPS server is disabled and no access is allowed:
> show running-config http

>
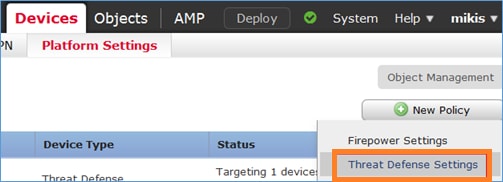
Step 1. Navigate to Devices > Platform Settings, click New Policy and choose Threat Defense Settings:
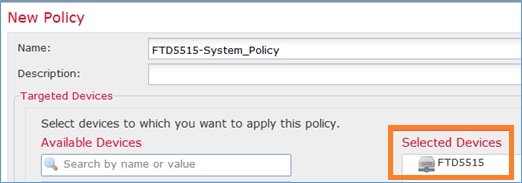
Specify the Policy name and Device Target:
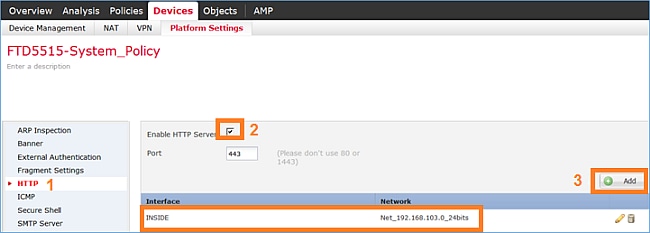
Step 2. Enable the HTTPS server and add the network that you want to be allowed to access the FTD device over HTTPS:
Save and Deploy.
During the policy deployment you can enable debug http in order to see the HTTP service starting:
> debug http 255
debug http enabled at level 255.
http_enable: Enabling HTTP server
HTTP server starting.
The result on FTD CLI is:
> unebug all
> show run http
http server enable
http 192.168.103.0 255.255.255.0 INSIDE
Open a browser on Host-A (192.168.103.1) and use this URL in order to download the first capture:
https://192.168.103.62/capture/CAPI/pcap/CAPI.pcap
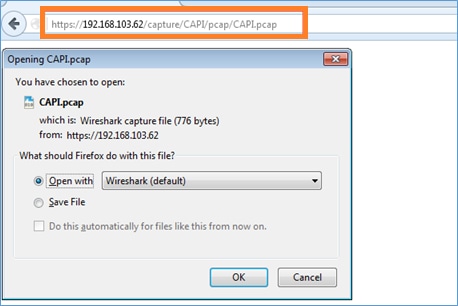
For reference:
| https://192.168.103.62/capture/CAPI/pcap/CAPI.pcap | IP of the FTD data interface where HTTP server is enabled |
| https://192.168.103.62/capture/CAPI/pcap/CAPI.pcap | The name of the FTD capture |
| https://192.168.103.62/capture/CAPI/pcap/CAPI.pcap | The name of the file that will be downloaded |
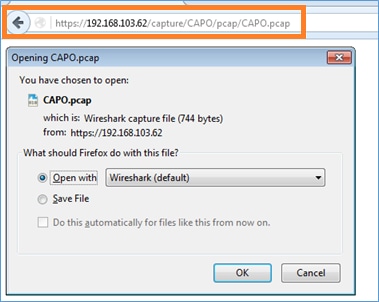
For the second capture:
https://192.168.103.62/capture/CAPO/pcap/CAPO.pcap
Work with FTD LINA Engine Captures – Export a Capture via FTP/TFTP/SCP
Requirements
Export the captures taken in the previous scenarios with FTP/TFTP/SCP protocols.
Solution
Export a capture to an FTP server:
firepower# copy /pcap capture:CAPI ftp://ftp_username:ftp_password@192.168.78.73/CAPI.pcap

Source capture name [CAPI]?

Address or name of remote host [192.168.78.73]?

Destination username [ftp_username]?

Destination password [ftp_password]?

Destination filename [CAPI.pcap]?
!!!!!!
114 packets copied in 0.170 secs
firepower#
Export a capture to a TFTP server:
firepower# copy /pcap capture:CAPI tftp://192.168.78.73

Source capture name [CAPI]?

Address or name of remote host [192.168.78.73]?

Destination filename [CAPI]?
!!!!!!!!!!!!!!!!
346 packets copied in 0.90 secs

firepower#
Export a capture to an SCP server:
firepower# copy /pcap capture:CAPI scp://scp_username:scp_password@192.168.78.55

Source capture name [CAPI]?

Address or name of remote host [192.168.78.55]?

Destination username [scp_username]?

Destination filename [CAPI]?
The authenticity of host '192.168.78.55 (192.168.78.55)' can't be established.
RSA key fingerprint is <cb:ca:9f:e9:3c:ef:e2:4f:20:f5:60:21:81:0a:85:f9:02:0d:0e:98:d0:9b:6c:dc:f9:af:49:9e:39:36:96:33>(SHA256).
Are you sure you want to continue connecting (yes/no)? yes
Warning: Permanently added '192.168.78.55' (SHA256) to the list of known hosts.
!!!!!!!!!!!!!!!!!!!!!!!!!!!!!!!!!!!!!!!!!!!!!!!!!!!!!!!!!!!!!!!!!!!!!!!!!!!!!!!!!
454 packets copied in 3.950 secs (151 packets/sec)

firepower#
Work with FTD LINA Engine Captures – Trace a Real Traffic Packet
Requirements
Enable a capture on FTD with these filters:
| Source IP | 192.168.103.1 |
| Destination IP | 192.168.101.1 |
| Protocol | ICMP |
| Interface | INSIDE |
| Packet tracing | yes |
| Number of tracing packets | 100 |
Ping from Host-A (192.168.103.1) the Host-B (192.168.101.1) and check the captures.
Solution
Tracing a real packet can be very useful to troubleshoot connectivity issues. It allows you to see all the internal checks that a packet goes through. Add the trace detail keywords and specify the amount of packets that you want to be traced. By default, the FTD traces the first 50 ingress packets.
In this case, enable capture with trace detail for the first 100 packets that FTD receives on INSIDE interface:
> capture CAPI2 interface INSIDE trace detail trace-count 100 match icmp host 192.168.103.1 host 192.168.101.1
Ping from Host-A to Host-B and check the result:
The captured packets are:
> show capture CAPI2
8 packets captured
   1: 18:08:04.232989  802.1Q vlan#1577 P0 192.168.103.1 > 192.168.101.1: icmp: echo request
   2: 18:08:04.234622  802.1Q vlan#1577 P0 192.168.101.1 > 192.168.103.1: icmp: echo reply
   3: 18:08:05.223941  802.1Q vlan#1577 P0 192.168.103.1 > 192.168.101.1: icmp: echo request
   4: 18:08:05.224872  802.1Q vlan#1577 P0 192.168.101.1 > 192.168.103.1: icmp: echo reply
   5: 18:08:06.222309  802.1Q vlan#1577 P0 192.168.103.1 > 192.168.101.1: icmp: echo request
   6: 18:08:06.223148  802.1Q vlan#1577 P0 192.168.101.1 > 192.168.103.1: icmp: echo reply
   7: 18:08:07.220752  802.1Q vlan#1577 P0 192.168.103.1 > 192.168.101.1: icmp: echo request
   8: 18:08:07.221561  802.1Q vlan#1577 P0 192.168.101.1 > 192.168.103.1: icmp: echo reply
8 packets shown
This output shows a trace of the first packet. The interesting parts are:
- Phase 12 where can be seen the ‘forward flow’. This is the LINA engine Dispatch Array (effectively the internal order of operations)
- Phase 13 where FTD sends the packet to Snort instance
- Phase 14 where the Snort Verdict is seen
> show capture CAPI2 packet-number 1 trace detail
8 packets captured
   1: 18:08:04.232989 000c.2998.3fec a89d.2193.2293 0x8100 Length: 78
      802.1Q vlan#1577 P0 192.168.103.1 > 192.168.101.1: icmp: echo request (ttl 128, id 3346)
Phase: 1
Type: CAPTURE
... output omitted ...

Phase: 12
Type: FLOW-CREATION
Subtype:
Result: ALLOW
Config:
Additional Information:
New flow created with id 195, packet dispatched to next module
Module information for forward flow ...
snp_fp_inspect_ip_options
snp_fp_snort
snp_fp_inspect_icmp
snp_fp_adjacency
snp_fp_fragment
snp_ifc_stat

Module information for reverse flow ...
snp_fp_inspect_ip_options
snp_fp_inspect_icmp
snp_fp_snort
snp_fp_adjacency
snp_fp_fragment
snp_ifc_stat

Phase: 13
Type: EXTERNAL-INSPECT
Subtype:
Result: ALLOW
Config:
Additional Information:
Application: 'SNORT Inspect'

Phase: 14
Type: SNORT
Subtype:
Result: ALLOW
Config:
Additional Information:
Snort Verdict: (pass-packet) allow this packet

... output omitted ...

Result:
input-interface: OUTSIDE
input-status: up
input-line-status: up
output-interface: OUTSIDE
output-status: up
output-line-status: up
Action: allow

1 packet shown
>
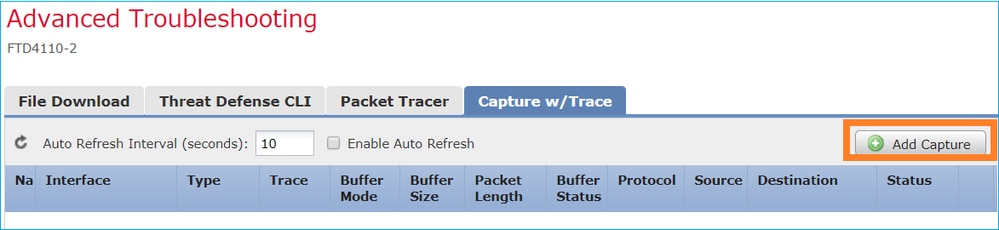
Capture Tool in Post-6.2 FMC Software Versions
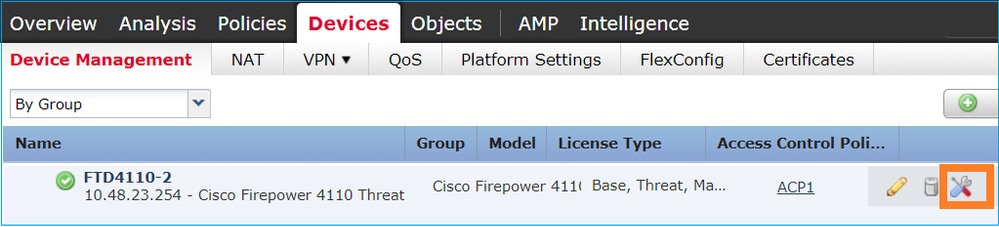
In FMC Version 6.2.x, a new packet capture wizard was introduced. Navigate to Devices > Device Management and click the Troubleshooticon. Then choose Advanced Troubleshooting and finally Capture w/Trace.
Choose Add Capture to create an FTD capture:
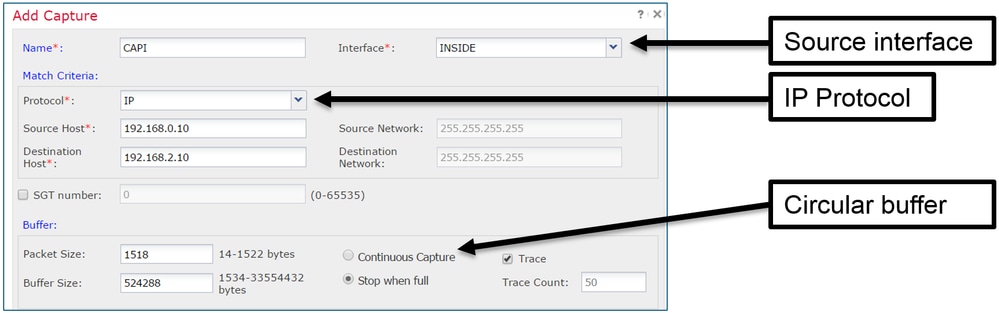
The current FMC UI limitations are:
- Cannot specify Src and Dst ports
- Only basic IP Protocols can be matched
- Cannot enable capture for LINA engine ASP Drops
Workaround – Use the FTD CLI.
As soon as you apply a capture from the FMC UI the capture is running:
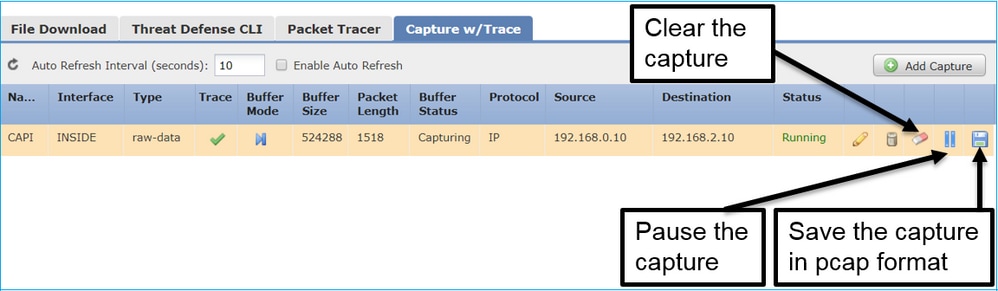
The capture on FTD CLI:
> show capture
capture CAPI%intf=INSIDE% type raw-data trace interface INSIDE [Capturing - 0 bytes]
  match ip host 192.168.0.10 host 192.168.2.10
>
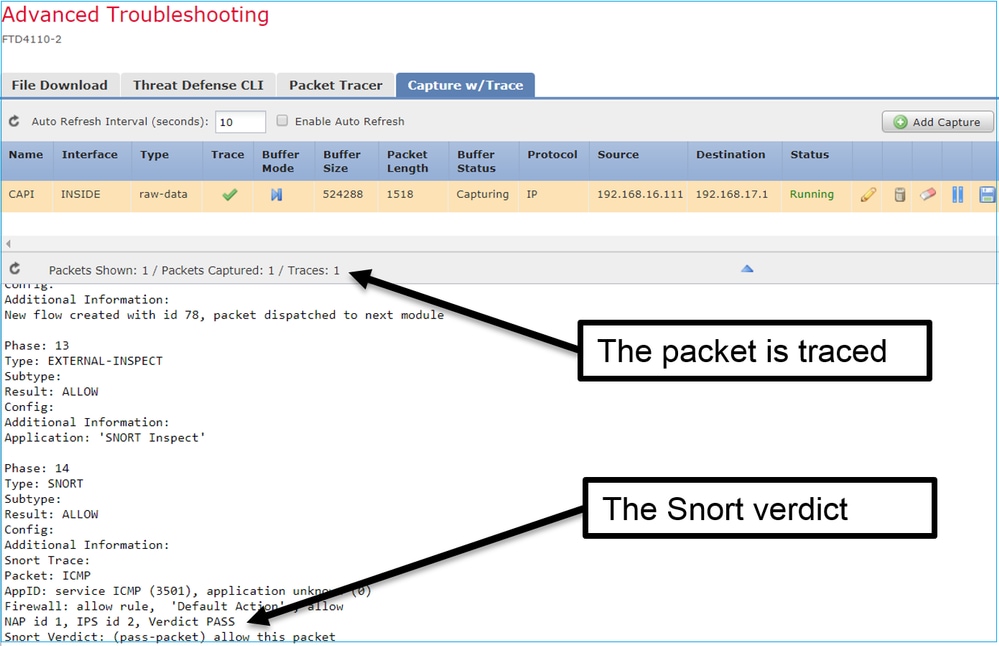
Trace a Real Packet on Post-6.2 FMC
On FMC 6.2.x, the Capture w/Trace wizard allows you to capture and trace real packets on FTD:
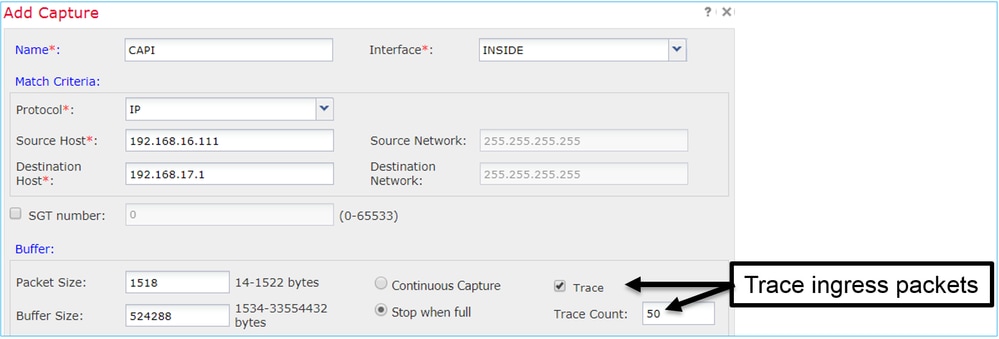
You can check the traced packet in the FMC UI:
FTD Packet Tracer Utility
Requirements
Use the Packet Tracer utility for this flow and check how the packet will be handled internally:
| Ingress interface | INSIDE |
| Protocol | ICMP echo request |
| Source IP | 192.168.103.1 |
| Destination IP | 192.168.101.1 |
Solution
Packet Tracer will generate a virtual packet. As shown in this example, the packet is a subject to Snort inspection. A capture taken at the same time at Snort-level (capture-traffic) shows the ICMP echo request:
> packet-tracer input INSIDE icmp 192.168.103.1 8 0 192.168.101.1

Phase: 1
Type: CAPTURE
Subtype:
Result: ALLOW
Config:
Additional Information:
MAC Access list

Phase: 2
Type: ACCESS-LIST
Subtype:
Result: ALLOW
Config:
Implicit Rule
Additional Information:
MAC Access list

Phase: 3
Type: ROUTE-LOOKUP
Subtype: Resolve Egress Interface
Result: ALLOW
Config:
Additional Information:
found next-hop 192.168.101.1 using egress ifc  OUTSIDE

Phase: 4
Type: ACCESS-LIST
Subtype: log
Result: ALLOW
Config:
access-group CSM_FW_ACL_ global
access-list CSM_FW_ACL_ advanced permit ip 192.168.103.0 255.255.255.0 192.168.101.0 255.255.255.0 rule-id 268436482 event-log both
access-list CSM_FW_ACL_ remark rule-id 268436482: ACCESS POLICY: FTD5515 - Mandatory/1
access-list CSM_FW_ACL_ remark rule-id 268436482: L4 RULE: Allow ICMP
Additional Information:
 This packet will be sent to snort for additional processing where a verdict will be reached

... output omitted ...

Phase: 12
Type: FLOW-CREATION
Subtype:
Result: ALLOW
Config:
Additional Information:
New flow created with id 203, packet dispatched to next module

Phase: 13
Type: SNORT
Subtype:
Result: ALLOW
Config:
Additional Information:
Snort Trace:
Packet: ICMP
AppID: service ICMP (3501), application unknown (0)
Firewall: allow rule, id 268440225, allow
NAP id 2, IPS id 0, Verdict PASS
Snort Verdict: (pass-packet) allow this packet


Result:
input-interface: INSIDE
input-status: up
input-line-status: up
output-interface: OUTSIDE
output-status: up
output-line-status: up
Action: allow

>
The Snort-level capture during the packet-tracer test shows the virtual packet:
> capture-traffic

Please choose domain to capture traffic from:
  0 - management0
  1 - Router

Selection? 1

Please specify tcpdump options desired.
(or enter '?' for a list of supported options)
Options: -n
13:27:11.939755 IP 192.168.103.1 > 192.168.101.1: ICMP echo request, id 0, seq 0, length 8
Packet Tracer UI Tool in Post-6.2 FMC Software Versions
In FMC Version 6.2.x the Packet Tracer UI tool was introduced. The tool is accessible in the same way as the capture tool and allows you to run Packet Tracer on FTD from the FMC UI:

Leave A Comment?